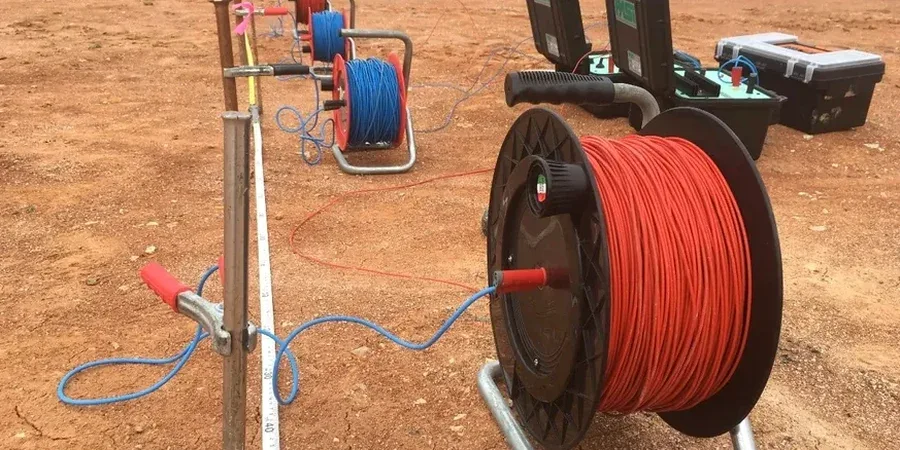
The resistivity meter gets unpacked at a site off Autoroute 25, stainless steel electrodes pushed into the silty clay that defines much of Terrebonne’s lowlands. A current is injected and the resulting potential difference reveals what lies beneath—sand layers, clay pockets, or the limestone bedrock that sits 15 to 30 meters deep across the city. In a municipality where urban expansion is pushing into former agricultural land between the Mille-Îles and Maskinongé rivers, knowing the subsurface before excavation is not optional. Vertical electrical sounding in Terrebonne maps these contrasts without disturbing the ground, delivering a continuous resistivity profile that helps engineers decide where to dig and where to reinforce. We run the survey, process the apparent resistivity data with inversion software, and hand over a cross-section that shows distinct geoelectric layers—critical when a CPT test needs targeting or a foundation design demands accurate depth-to-bedrock data.
Electrical resistivity in Terrebonne reveals the hidden boundary between conductive Champlain clay and resistive limestone bedrock in less than a day of fieldwork.
Methodology applied in Terrebonne
Local geotechnical conditions in Terrebonne
Terrebonne’s position on the north shore of the Mille-Îles River means groundwater fluctuates with spring melt and autumn rains, saturating the upper clay layer and lowering its resistivity to near-seawater values. This seasonal swing can mask subtle stratigraphic boundaries if the survey is rushed or the electrode contact is poor. Frozen surface conditions in January and February present another challenge—resistivity spikes at the near-surface, requiring longer current injection times and sometimes pre-wetting the electrode positions. The team adjusts the array geometry and acquisition parameters on-site to compensate, but clients who schedule surveys between April and October typically get the cleanest profiles with the shortest turnaround. Ignoring these local conditions risks misidentifying a conductive clay lens as a water-bearing sand, which has direct consequences for excavation dewatering plans and foundation type selection.
Our services
The electrical resistivity surveys we run in Terrebonne cover two primary configurations, selected based on the project’s depth requirements and site access constraints.
1D Vertical Electrical Sounding (VES)
A single-point depth investigation using the Schlumberger array. Electrode spacing expands symmetrically around a fixed center, building a layered resistivity model directly below the point. Ideal for determining bedrock depth, identifying clay thickness, and calibrating with borehole data.
2D Electrical Resistivity Tomography (ERT)
A multi-electrode profile that produces a continuous cross-section of resistivity along a survey line. We use 48 to 72 electrodes with Wenner or dipole-dipole configurations. Best suited for mapping lateral changes—channel fills, fault zones, or contaminant plume boundaries across longer transects.
Questions and answers
How long does a resistivity survey take on a typical Terrebonne lot?
A single VES sounding at one location takes 30 to 60 minutes of field time. A 2D tomography line with 48 electrodes along 100 meters takes about two hours. Data processing and interpretation add one to two business days before the report is delivered.
What does an electrical resistivity survey cost in Terrebonne?
For a single VES point with a full interpreted report, the cost ranges from CA$850 to CA$1,340 depending on access conditions and the spacing sequence required. A 2D tomography line is quoted per linear meter after reviewing the site layout and target depth.
Can resistivity distinguish between clay and silt in the Champlain Sea deposits?
Partially. Both are conductive, but clean silt typically reads 15–30 ohm-m while sensitive marine clay drops below 10 ohm-m. The resistivity contrast is subtle and depends on pore water salinity. We cross-reference with available borehole logs or a nearby SPT to confirm the interpretation where the boundary is critical for foundation design.